Sử dụng thư viện Pandas để khám phá dữ liệu
Pandas là một thư viện mã nguồn mở để mọi người có thể xử lý và phân tích dữ liệu. Pandas có để đọc dữ liệu từ các file excel, csv,... lên để phân tích. Trong pandas có nhiều hàm hỗ trợ cho việc tính toán dữ liệu, gộp bảng,... vì vậy hôm nay chúng ta sẽ tìm hiểu một số hàm đơn giản trong bộ thư viện này nhé.

Giới thiệu chung:
Pandas là một thư viện mã nguồn mở để mọi người có thể xử lý và phân tích dữ liệu. Pandas có để đọc dữ liệu từ các file excel, csv,... lên để phân tích. Trong pandas có nhiều hàm hỗ trợ cho việc tính toán dữ liệu, gộp bảng,... vì vậy hôm nay chúng ta sẽ tìm hiểu một số hàm đơn giản trong bộ thư viện này nhé.
Kết hợp với pandas thì chúng ta sẽ sử dụng thêm thư viện matplotlib để hiển thị biểu đồ trực quan phần tính toán của chúng ta.
Về bộ dữ liệu thì chúng ta sẽ sử dụng bộ dữ liệu My Uber Drives (https://www.kaggle.com/zusmani/uberdrives). Bộ dữ liệu này bao gồm chi tiết các cuộc đặt xe và dùng để nghiên cứu hành vi của một người dùng uber bình thường. Bộ dữ liệu bao gồm các cột dữ liệu: thời gian bắt đầu, thời gian hoàn thành, địa điểm bắt đầu, địa điểm kết thúc, quãng đường đi và mục đích của chuyến đi (đi làm, việc cá nhân, đi đến cuộc gặp, ...). Ở đây chúng ta sẽ sử dụng pandas và matplotlib để xem xét 3 điều.
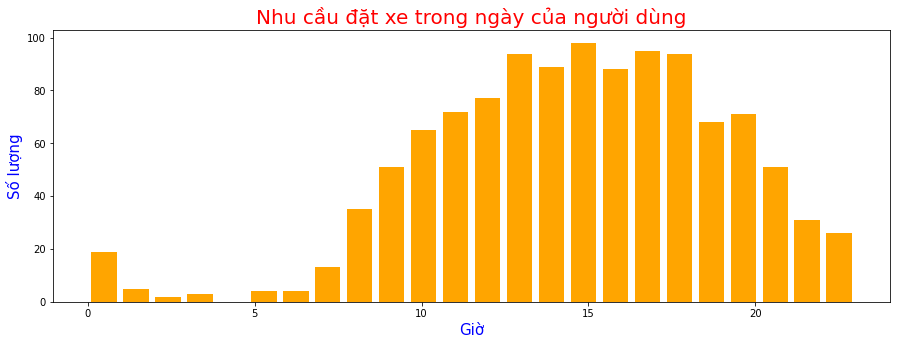
- Xem nhu cầu đặt xe trong ngày của người dùng.
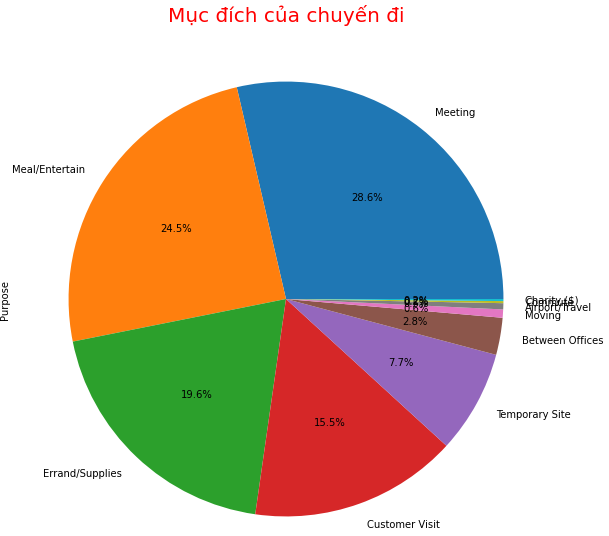
- Mục đích của chuyến đi, xem thử người dùng thường sử dụng Uber cho những việc gì.
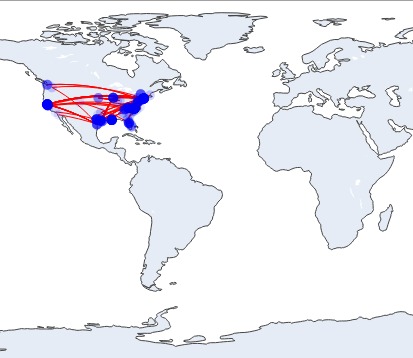
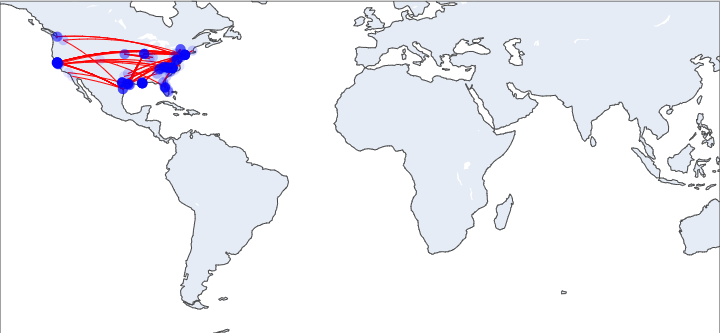
- Và chúng ta sẽ vẽ bản đồ kết nối, để có cái nhìn trực quan hơn về các chuyến đi.
Khai báo thư viện
import numpy as np
import pandas as pd
import matplotlib.pyplot as plt
import datetime, time
from datetime import timedelta
import plotly.graph_objects as go
Đọc dữ liệu và xem thông tin bảng dữ liệu
data = pd.read_csv('My Uber Drives - 2016.csv')
data.info()
<class 'pandas.core.frame.DataFrame'>
RangeIndex: 1156 entries, 0 to 1155
Data columns (total 7 columns):
 #   Column       Non-Null Count  Dtype
---  ------       --------------  -----
 0   START_DATE*  1156 non-null   object
 1   END_DATE*    1155 non-null   object
 2   CATEGORY*    1155 non-null   object
 3   START*       1155 non-null   object
 4   STOP*        1155 non-null   object
 5   MILES*       1156 non-null   float64
 6   PURPOSE*     653 non-null    object
dtypes: float64(1), object(6)
memory usage: 63.3+ KB
Dữ liệu có 1156 dòng, 7 cột
START_DATE (Thời gian đặt chuyến đi):
END_DATE (thời gian hoàn thành chuyến đi)
CATEGORY (phân loại chuyến đi)
START (địa điểm bắt đầu)
STOP (địa điểm tới)
MILES (quãng đường đi)
PURPOSE (mục đích)
data.head()
| START_DATE* | END_DATE* | CATEGORY* | START* | STOP* | MILES* | PURPOSE* | |
|---|---|---|---|---|---|---|---|
| 0 | 1/1/2016 21:11 | 1/1/2016 21:17 | Business | Fort Pierce | Fort Pierce | 5.1 | Meal/Entertain |
| 1 | 1/2/2016 1:25 | 1/2/2016 1:37 | Business | Fort Pierce | Fort Pierce | 5.0 | NaN |
| 2 | 1/2/2016 20:25 | 1/2/2016 20:38 | Business | Fort Pierce | Fort Pierce | 4.8 | Errand/Supplies |
| 3 | 1/5/2016 17:31 | 1/5/2016 17:45 | Business | Fort Pierce | Fort Pierce | 4.7 | Meeting |
| 4 | 1/6/2016 14:42 | 1/6/2016 15:49 | Business | Fort Pierce | West Palm Beach | 63.7 | Customer Visit |
data.rename({'START_DATE*':'StartDate',
             'END_DATE*'  :'EndDate'  ,
             'CATEGORY*'  :'Category' ,
             'START*'     :'Start'    ,
             'STOP*'      :'Stop'     ,
             'MILES*'     :'Miles'    ,
             'PURPOSE*'   :'Purpose'}, axis=1, inplace=True)
data.head()
| StartDate | EndDate | Category | Start | Stop | Miles | Purpose | |
|---|---|---|---|---|---|---|---|
| 0 | 1/1/2016 21:11 | 1/1/2016 21:17 | Business | Fort Pierce | Fort Pierce | 5.1 | Meal/Entertain |
| 1 | 1/2/2016 1:25 | 1/2/2016 1:37 | Business | Fort Pierce | Fort Pierce | 5.0 | NaN |
| 2 | 1/2/2016 20:25 | 1/2/2016 20:38 | Business | Fort Pierce | Fort Pierce | 4.8 | Errand/Supplies |
| 3 | 1/5/2016 17:31 | 1/5/2016 17:45 | Business | Fort Pierce | Fort Pierce | 4.7 | Meeting |
| 4 | 1/6/2016 14:42 | 1/6/2016 15:49 | Business | Fort Pierce | West Palm Beach | 63.7 | Customer Visit |
1. Xem nhu cầu đặt xe trong ngày của người dùng
Vì muốn thống kê như cầu book xe trong 1 ngày. Nên đầu tiên chúng ta sẽ format cột StartDate từ kiểu dữ liệu Object sang kiểu dữ liệu thời gian và tạo thêm cột giờ đặt xe lấy thông tin từ cột StartDate
df = data[['StartDate','EndDate','Category','Start','Stop','Miles']]
df = df.dropna()
df.head()
| StartDate | EndDate | Category | Start | Stop | Miles | |
|---|---|---|---|---|---|---|
| 0 | 1/1/2016 21:11 | 1/1/2016 21:17 | Business | Fort Pierce | Fort Pierce | 5.1 |
| 1 | 1/2/2016 1:25 | 1/2/2016 1:37 | Business | Fort Pierce | Fort Pierce | 5.0 |
| 2 | 1/2/2016 20:25 | 1/2/2016 20:38 | Business | Fort Pierce | Fort Pierce | 4.8 |
| 3 | 1/5/2016 17:31 | 1/5/2016 17:45 | Business | Fort Pierce | Fort Pierce | 4.7 |
| 4 | 1/6/2016 14:42 | 1/6/2016 15:49 | Business | Fort Pierce | West Palm Beach | 63.7 |
df.StartDate = pd.to_datetime(df.StartDate, errors='coerce')
df.EndDate = pd.to_datetime(df.EndDate)
df.head()
| StartDate | EndDate | Category | Start | Stop | Miles | |
|---|---|---|---|---|---|---|
| 0 | 2016-01-01 21:11:00 | 2016-01-01 21:17:00 | Business | Fort Pierce | Fort Pierce | 5.1 |
| 1 | 2016-01-02 01:25:00 | 2016-01-02 01:37:00 | Business | Fort Pierce | Fort Pierce | 5.0 |
| 2 | 2016-01-02 20:25:00 | 2016-01-02 20:38:00 | Business | Fort Pierce | Fort Pierce | 4.8 |
| 3 | 2016-01-05 17:31:00 | 2016-01-05 17:45:00 | Business | Fort Pierce | Fort Pierce | 4.7 |
| 4 | 2016-01-06 14:42:00 | 2016-01-06 15:49:00 | Business | Fort Pierce | West Palm Beach | 63.7 |
df["TimeOfDate"] = df['StartDate'].dt.hour
df.head()
| StartDate | EndDate | Category | Start | Stop | Miles | TimeOfDate | |
|---|---|---|---|---|---|---|---|
| 0 | 2016-01-01 21:11:00 | 2016-01-01 21:17:00 | Business | Fort Pierce | Fort Pierce | 5.1 | 21 |
| 1 | 2016-01-02 01:25:00 | 2016-01-02 01:37:00 | Business | Fort Pierce | Fort Pierce | 5.0 | 1 |
| 2 | 2016-01-02 20:25:00 | 2016-01-02 20:38:00 | Business | Fort Pierce | Fort Pierce | 4.8 | 20 |
| 3 | 2016-01-05 17:31:00 | 2016-01-05 17:45:00 | Business | Fort Pierce | Fort Pierce | 4.7 | 17 |
| 4 | 2016-01-06 14:42:00 | 2016-01-06 15:49:00 | Business | Fort Pierce | West Palm Beach | 63.7 | 14 |
fig, ax = plt.subplots(figsize=(15,5))
plt.hist(df["TimeOfDate"].tolist(), bins=24, rwidth=0.8, color= 'orange')
plt.title("Nhu cầu đặt xe trong ngày của người dùng", fontsize = 20, color= 'red')
plt.xlabel("Giờ", fontsize = 15, color= 'blue')
plt.ylabel("Số lượng", fontsize = 15, color= 'blue')
plt.show()
Vì vậy có thể thấy khung giờ book xe tập trung từ 8h đến 24h.
Giờ cao điểm book là tập trung từ 13h đế 18h
2. Mục đích của chuyến đi
fig, ax = plt.subplots(figsize=(10,10))
data['Purpose'].value_counts(sort=True, ascending=False, dropna=True).plot(kind='pie', autopct='%1.1f%%')
plt.title("Mục đích của chuyến đi", fontsize = 20, color= 'red')
plt.show()
Vì vậy có thể thấy khách hàng sử dụng Uber phần lớn là để di chuyển đến các cuộc họp, bữa ăn/ khu giải trí, Công việc riêng/ đi giao hàng hay đến gặp khách hàng chiếm tới 88.2%
3. Vẽ bản đồ kết nối
Đầu tiên ta có bảng toạ độ (kinh độ và vĩ độ) các điểm đi và điểm đến.
Tiếp đến ở đây ta sẽ lọc các địa điểm ở Mỹ (Vì sữ liệu có một số nước, ở đây chỉ ví dụ ở nước Mỹ)
Tiếp đến là tạo bảng dữ liệu mới bao gồm dữ liệu uber kết hợp với bảng vị trí để lấy toạ độ từng điểm
Sau đó vẽ bản đồ kết nối
Đọc file dữ liệu toạ độ từng vị trí
dataLocalzation = pd.read_csv("name.csv")
dataLocalzation.head()
| Position | Latitude | Longitude | Country | |
|---|---|---|---|---|
| 0 | Fort Pierce | 27.429393 | -80.339559 | USA |
| 1 | West Palm Beach | 26.742175 | -80.269473 | USA |
| 2 | Cary | 35.891736 | -80.438089 | USA |
| 3 | Jamaica | 41.069470 | -77.296966 | USA |
| 4 | New York | 40.697668 | -74.260568 | USA |
Thêm các cột toạ độ điểm đi, điểm đến vào bảng dữ liệu chính
newData = pd.merge(df,dataLocalzation,left_on='Start',right_on='Position')
newData.head()
| StartDate | EndDate | Category | Start | Stop | Miles | TimeOfDate | Position | Latitude | Longitude | Country | |
|---|---|---|---|---|---|---|---|---|---|---|---|
| 0 | 2016-01-01 21:11:00 | 2016-01-01 21:17:00 | Business | Fort Pierce | Fort Pierce | 5.1 | 21 | Fort Pierce | 27.429393 | -80.339559 | USA |
| 1 | 2016-01-02 01:25:00 | 2016-01-02 01:37:00 | Business | Fort Pierce | Fort Pierce | 5.0 | 1 | Fort Pierce | 27.429393 | -80.339559 | USA |
| 2 | 2016-01-02 20:25:00 | 2016-01-02 20:38:00 | Business | Fort Pierce | Fort Pierce | 4.8 | 20 | Fort Pierce | 27.429393 | -80.339559 | USA |
| 3 | 2016-01-05 17:31:00 | 2016-01-05 17:45:00 | Business | Fort Pierce | Fort Pierce | 4.7 | 17 | Fort Pierce | 27.429393 | -80.339559 | USA |
| 4 | 2016-01-06 14:42:00 | 2016-01-06 15:49:00 | Business | Fort Pierce | West Palm Beach | 63.7 | 14 | Fort Pierce | 27.429393 | -80.339559 | USA |
newData.rename({'Position' :'PositionStart' ,
                'Latitude' :'LatitudeStart' ,
                'Longitude':'LongitudeStart',
                'Country'  :'CountryStart' }, axis=1, inplace=True)
newData.head()
| StartDate | EndDate | Category | Start | Stop | Miles | TimeOfDate | PositionStart | LatitudeStart | LongitudeStart | CountryStart | |
|---|---|---|---|---|---|---|---|---|---|---|---|
| 0 | 2016-01-01 21:11:00 | 2016-01-01 21:17:00 | Business | Fort Pierce | Fort Pierce | 5.1 | 21 | Fort Pierce | 27.429393 | -80.339559 | USA |
| 1 | 2016-01-02 01:25:00 | 2016-01-02 01:37:00 | Business | Fort Pierce | Fort Pierce | 5.0 | 1 | Fort Pierce | 27.429393 | -80.339559 | USA |
| 2 | 2016-01-02 20:25:00 | 2016-01-02 20:38:00 | Business | Fort Pierce | Fort Pierce | 4.8 | 20 | Fort Pierce | 27.429393 | -80.339559 | USA |
| 3 | 2016-01-05 17:31:00 | 2016-01-05 17:45:00 | Business | Fort Pierce | Fort Pierce | 4.7 | 17 | Fort Pierce | 27.429393 | -80.339559 | USA |
| 4 | 2016-01-06 14:42:00 | 2016-01-06 15:49:00 | Business | Fort Pierce | West Palm Beach | 63.7 | 14 | Fort Pierce | 27.429393 | -80.339559 | USA |
newData = pd.merge(newData,dataLocalzation,left_on='Stop',right_on='Position')
newData.head()
| StartDate | EndDate | Category | Start | Stop | Miles | TimeOfDate | PositionStart | LatitudeStart | LongitudeStart | CountryStart | Position | Latitude | Longitude | Country | |
|---|---|---|---|---|---|---|---|---|---|---|---|---|---|---|---|
| 0 | 2016-01-01 21:11:00 | 2016-01-01 21:17:00 | Business | Fort Pierce | Fort Pierce | 5.1 | 21 | Fort Pierce | 27.429393 | -80.339559 | USA | Fort Pierce | 27.429393 | -80.339559 | USA |
| 1 | 2016-01-02 01:25:00 | 2016-01-02 01:37:00 | Business | Fort Pierce | Fort Pierce | 5.0 | 1 | Fort Pierce | 27.429393 | -80.339559 | USA | Fort Pierce | 27.429393 | -80.339559 | USA |
| 2 | 2016-01-02 20:25:00 | 2016-01-02 20:38:00 | Business | Fort Pierce | Fort Pierce | 4.8 | 20 | Fort Pierce | 27.429393 | -80.339559 | USA | Fort Pierce | 27.429393 | -80.339559 | USA |
| 3 | 2016-01-05 17:31:00 | 2016-01-05 17:45:00 | Business | Fort Pierce | Fort Pierce | 4.7 | 17 | Fort Pierce | 27.429393 | -80.339559 | USA | Fort Pierce | 27.429393 | -80.339559 | USA |
| 4 | 2016-01-06 14:42:00 | 2016-01-06 15:49:00 | Business | Fort Pierce | West Palm Beach | 63.7 | 14 | Fort Pierce | 27.429393 | -80.339559 | USA | West Palm Beach | 26.742175 | -80.269473 | USA |
newData.rename({'Position' :'PositionStop' ,
                'Latitude' :'LatitudeStop' ,
                'Longitude':'LongitudeStop',
                'Country'  :'CountryStop' }, axis=1, inplace=True)
newData.head()
| StartDate | EndDate | Category | Start | Stop | Miles | TimeOfDate | PositionStart | LatitudeStart | LongitudeStart | CountryStart | PositionStop | LatitudeStop | LongitudeStop | CountryStop | |
|---|---|---|---|---|---|---|---|---|---|---|---|---|---|---|---|
| 0 | 2016-01-01 21:11:00 | 2016-01-01 21:17:00 | Business | Fort Pierce | Fort Pierce | 5.1 | 21 | Fort Pierce | 27.429393 | -80.339559 | USA | Fort Pierce | 27.429393 | -80.339559 | USA |
| 1 | 2016-01-02 01:25:00 | 2016-01-02 01:37:00 | Business | Fort Pierce | Fort Pierce | 5.0 | 1 | Fort Pierce | 27.429393 | -80.339559 | USA | Fort Pierce | 27.429393 | -80.339559 | USA |
| 2 | 2016-01-02 20:25:00 | 2016-01-02 20:38:00 | Business | Fort Pierce | Fort Pierce | 4.8 | 20 | Fort Pierce | 27.429393 | -80.339559 | USA | Fort Pierce | 27.429393 | -80.339559 | USA |
| 3 | 2016-01-05 17:31:00 | 2016-01-05 17:45:00 | Business | Fort Pierce | Fort Pierce | 4.7 | 17 | Fort Pierce | 27.429393 | -80.339559 | USA | Fort Pierce | 27.429393 | -80.339559 | USA |
| 4 | 2016-01-06 14:42:00 | 2016-01-06 15:49:00 | Business | Fort Pierce | West Palm Beach | 63.7 | 14 | Fort Pierce | 27.429393 | -80.339559 | USA | West Palm Beach | 26.742175 | -80.269473 | USA |
finalData = newData[['Start','Stop','LatitudeStart','LongitudeStart','LatitudeStop','LongitudeStop','CountryStart','CountryStop']]
finalData.head()
| Start | Stop | LatitudeStart | LongitudeStart | LatitudeStop | LongitudeStop | CountryStart | CountryStop | |
|---|---|---|---|---|---|---|---|---|
| 0 | Fort Pierce | Fort Pierce | 27.429393 | -80.339559 | 27.429393 | -80.339559 | USA | USA |
| 1 | Fort Pierce | Fort Pierce | 27.429393 | -80.339559 | 27.429393 | -80.339559 | USA | USA |
| 2 | Fort Pierce | Fort Pierce | 27.429393 | -80.339559 | 27.429393 | -80.339559 | USA | USA |
| 3 | Fort Pierce | Fort Pierce | 27.429393 | -80.339559 | 27.429393 | -80.339559 | USA | USA |
| 4 | Fort Pierce | West Palm Beach | 27.429393 | -80.339559 | 26.742175 | -80.269473 | USA | USA |
Lọc những địa điểm ở Mỹ
area = 'USA'
finalData = finalData[finalData.CountryStart == area]
finalData = finalData[finalData.CountryStop == area]
finalData.head()
| Start | Stop | LatitudeStart | LongitudeStart | LatitudeStop | LongitudeStop | CountryStart | CountryStop | |
|---|---|---|---|---|---|---|---|---|
| 0 | Fort Pierce | Fort Pierce | 27.429393 | -80.339559 | 27.429393 | -80.339559 | USA | USA |
| 1 | Fort Pierce | Fort Pierce | 27.429393 | -80.339559 | 27.429393 | -80.339559 | USA | USA |
| 2 | Fort Pierce | Fort Pierce | 27.429393 | -80.339559 | 27.429393 | -80.339559 | USA | USA |
| 3 | Fort Pierce | Fort Pierce | 27.429393 | -80.339559 | 27.429393 | -80.339559 | USA | USA |
| 4 | Fort Pierce | West Palm Beach | 27.429393 | -80.339559 | 26.742175 | -80.269473 | USA | USA |
plotData = finalData.groupby(['Start', 'Stop','LatitudeStart','LongitudeStart','LatitudeStop', 'LongitudeStop','CountryStart','CountryStop']).size().reset_index(name='counts')
plotData.head()
| Start | Stop | LatitudeStart | LongitudeStart | LatitudeStop | LongitudeStop | CountryStart | CountryStop | counts | |
|---|---|---|---|---|---|---|---|---|---|
| 0 | Agnew | Agnew | 41.016979 | -96.832294 | 41.016979 | -96.832294 | USA | USA | 1 |
| 1 | Agnew | Cory | 41.016979 | -96.832294 | 39.346910 | -87.399299 | USA | USA | 1 |
| 2 | Agnew | Renaissance | 41.016979 | -96.832294 | 39.779400 | -86.155031 | USA | USA | 2 |
| 3 | Almond | Bryson City | 35.369849 | -83.582717 | 35.425821 | -83.480025 | USA | USA | 1 |
| 4 | Apex | Apex | 35.727641 | -78.935007 | 35.727641 | -78.935007 | USA | USA | 2 |
Vẽ bản đồ kết nối
fig = go.Figure()

source_to_dest = zip(plotData["LatitudeStart"], plotData["LatitudeStop"],
                     plotData["LongitudeStart"], plotData["LongitudeStop"],
                     plotData["counts"])

for slat,dlat, slon, dlon, num_flights in source_to_dest:
    fig.add_trace(go.Scattergeo(
                        lat = [slat,dlat],
                        lon = [slon, dlon],
                        mode = 'lines',
                        line = dict(width = 1, color="red")
                        ))

cities = plotData["Start"].values.tolist() + plotData["Stop"].values.tolist()
countries = plotData["CountryStart"].values.tolist() + plotData["CountryStop"].values.tolist()
scatter_hover_data = [country + " : "+ city for city, country in zip(cities, countries)]

fig.add_trace(
    go.Scattergeo(
                lon = plotData["LongitudeStart"].values.tolist() + plotData["LongitudeStop"].values.tolist(),
                lat = plotData["LatitudeStart"].values.tolist() + plotData["LatitudeStop"].values.tolist(),
                hoverinfo = 'text',
                text = scatter_hover_data,
                mode = 'markers',
                marker = dict(size = 10, color = 'blue', opacity=0.1))
    )

fig.update_layout(title_text="Connection Map Uber Drivers In USA",
                  height=480, width=720,
                  margin={"t":0,"b":0,"l":0, "r":0, "pad":0},
                  showlegend=False)

fig.show()

Liên hệ
TIN NỔI BẬT


 share
share
 tweet
tweet


